Wealth Insights
The Tech Wreck
By Hightower Advisors / September 3, 2025

Lower Valuation Equities are Outperforming
The S&P 500 P/E valuation multiple has ended the year above its 20-year average P/E multiple for five of the last six years. This can largely be attributed to the massive liquidity that has been put in place as well as historically low interest rates. The start of this year has seen multiple contractions as the Fed is about to embark on significant change to monetary policy which will remove quantitative easing and begin an interest rate tightening cycle. We’ve written before: higher rates are not positive for long duration assets, especially those companies with high valuations and zero earnings.
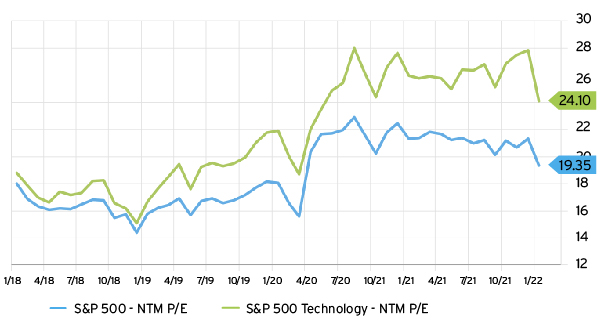
The underperformers are concentrated in a subset of, and most fall within, the technology and growth sectors. The technology sector within the S&P 500 is down (13.3%) year-to-date, as of this writing. Technology stocks tend to have higher P/E multiples, based on future growth potential and greater exposure to wage increases during inflationary periods.
Extended valuations that are predicated on future growth potential and discounted at risk-adjusted rates, tend to fall when interest rates are projected to rise. Active equity fund managers have also maintained their largest overweight positions in technology, according to UBS. In addition, the Information Technology sector combined with the Communication Services sector accounts for 38% of the S&P 500 weighting.
Meanwhile, equities priced at attractive valuations that maintain high quality balance sheets, profit margins and revenue growth should be expected to outperform during periods of high GDP growth and inflation. They should also benefit from portfolio rebalancing if their index weightings increase because of the broader market rotation into lower P/E.
In the S&P 500 index, there are zero technology companies in the top 35 performers year-to-date. Through the same period in 2021, technology represented 17% of the top 35 performers, 43% in 2020 and 23% in 2019. Meanwhile, technology represents over 40% of the bottom 35 performers. The next-twelve-months (NTM) P/E multiple for those same bottom technology stocks is 50.0x, compared to the index average 24.7x. Technology has been one of the top five performing sectors year-to-date through January 25 for the past 4/5 years (2017-2021) – this year it’s second-to-last.
Names that outperformed during the pandemic, benefitting from stay-at-home trends and lofty growth projections, are leading the fall downward. Within the Russell 1000 index, 65% of the bottom 20 year-to-date performers have negative projected earnings over the next twelve months. 100% of the top 20 year-to-date performers have positive projected earnings over the next twelve months. This disconnect between projected negative earnings and positive performance places clear emphasis on the importance of buying profitable, real earnings-based valued stocks, rather than those valued on excitable projections, especially in a policy tightening environment.
Sectors with the lowest aggregate weighted NTM P/E multiples within the S&P 500 include energy (12.6x), financials (14.5x) and materials (15.5x). The S&P 500 Value, which is outperforming the S&P 500 Growth by 986 bps as of this writing, is trading at a weighted aggregate 34% NTM P/E discount vs. its growth equivalent.
Chart 1: Technology Sector’s Elevated NTM P/E Multiple1
Earnings Takeaways
We’re monitoring for buying opportunities on sale and maintaining conviction in our investments in what we believe to be already attractively priced stocks. It’s still the early stages of earnings season, but there are a few key themes to highlight.
First, companies that exhibited strong pricing power in Q3/Q4 2021 should see a tailwind in 2022 as some inflationary cost pressures ease. Companies including MMM and PG indicated that their higher pricing has not deterred order demand. That pricing power is contributing to stronger margins and higher free cash flow. Free cash flow offers companies the flexibility to create value for shareholders by reinvesting in their businesses or increasing their shareholder returns programs.
Chart 2: Multi-Sector Free Cash Flow Growth, Energy a Standout2
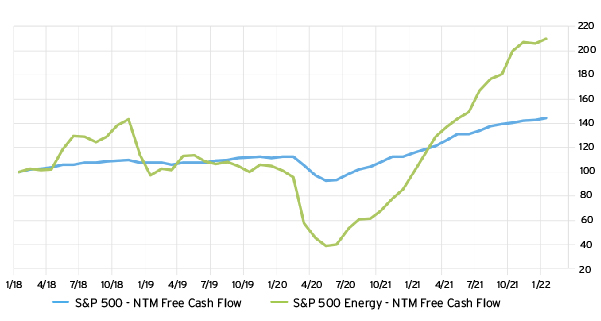
Second, the energy industry’s growth will be supply-driven through 2022 as oil & gas companies increase capital spending. Despite industry reinvestment towards additional supply, it’s likely to remain a supply-constrained market and supportive of oil prices. SLB predicts that “the macro environment is increasingly supportive of a potential supercycle” that will contribute to increased margins and free cash flow.
Third, spending recovery has been robust and credit card spend has neared pre-COVID levels. That said, business travel and entertainment (T&E) lags farther behind. AXP cited, “T&E spending reaching 82% of 2019 levels in the fourth quarter.” As the re-opening continues and pent-up demand remains strong, industries will continue to benefit from the drawn-out recovery and we believe there’s room for growth.
Lastly, supply chains and inflation remain key themes and we’ll be paying close attention to the data and company commentary throughout 2022. Companies continue to indicate a slow recovery of the supply chain challenges, including chip shortages for electronics, autos and health care. Higher materials, logistics and labor costs continue to be headwinds, though companies are better positioned in their supply management and pricing power for 2022 than they were in 2021.
Stephanie Link: CNBC TV Schedule

Sources
- Source: FactSet (chart)
- Source: FactSet (chart)
Disclosures
Investment Solutions at Hightower Advisors is a team of investment professionals registered with Hightower Securities, LLC, member FINRA/SIPC, & Hightower Advisors, LLC a registered investment advisor with the SEC. All securities are offered through Hightower Securities, LLC and advisory services are offered through Hightower Advisors, LLC. This is not an offer to buy or sell securities. No investment process is free of risk and there is no guarantee that the investment process described herein will be profitable. Investors may lose all of their investments. Past performance is not indicative of current or future performance and is not a guarantee. In preparing these materials, we have relied upon and assumed without independent verification, the accuracy and completeness of all information available from public and internal sources; as such, neither the information nor any opinion expressed constitutes a solicitation for the purchase or sale of any security. Hightower shall not in any way be liable for claims and make no expressed or implied representations or warranties as to their accuracy or completeness or for statements or errors contained in or omissions from them. This document was created for informational purposes only; the opinions expressed are solely those of the author, and do not represent those of Hightower Advisors, LLC or any of its affiliates.
Hightower Advisors is a group comprised of investment professionals registered with Hightower Advisors, LLC, an SEC registered investment adviser. Some investment professionals may also be registered with Hightower Securities, LLC (member FINRA and SIPC). Advisory services are offered through Hightower Advisors, LLC. Securities are offered through Hightower Securities, LLC.
This is not an offer to buy or sell securities, nor should anything contained herein be construed as a recommendation or advice of any kind. Consult with an appropriately credentialed professional before making any financial, investment, tax or legal decision. No investment process is free of risk, and there is no guarantee that any investment process or investment opportunities will be profitable or suitable for all investors. Past performance is neither indicative nor a guarantee of future results. You cannot invest directly in an index.
These materials were created for informational purposes only; the opinions and positions stated are those of the author(s) and are not necessarily the official opinion or position of Hightower Advisors, LLC or its affiliates (“Hightower”). Any examples used are for illustrative purposes only and based on generic assumptions. All data or other information referenced is from sources believed to be reliable but not independently verified. Information provided is as of the date referenced and is subject to change without notice. Hightower assumes no liability for any action made or taken in reliance on or relating in any way to this information. Hightower makes no representations or warranties, express or implied, as to the accuracy or completeness of the information, for statements or errors or omissions, or results obtained from the use of this information. References to any person, organization, or the inclusion of external hyperlinks does not constitute endorsement (or guarantee of accuracy or safety) by Hightower of any such person, organization or linked website or the information, products or services contained therein.
Click here for definitions of and disclosures specific to commonly used terms.

200 W Madison, 25th Floor
Chicago, IL 60606
(312) 962-3800
300 Madison Ave, 29th Floor
New York, NY 10017
(917) 286-2717
Legal & Privacy
Web Accessibility Policy
Form Client Relationship Summary ("Form CRS") is a brief summary of the brokerage and advisor services we offer.
HTA Client Relationship Summary
HTS Client Relationship Summary
Securities offered through Hightower Securities, LLC, Member FINRA/SIPC, Hightower Advisors, LLC is a SEC registered investment adviser. brokercheck.finra.org
©2026 Hightower Advisors. All Rights Reserved.